
CRE Financial Modeling and Valuation App
Our CRE financial modeling app gives investors, owners and brokers a faster way to underwrite commercial property. Build a lease-by-lease cash flow, run a discounted cash flow analysis, calculate IRR and test financing scenarios for office, industrial, retail and multifamily assets, then save your models and export them to Excel.

Lease-by-lease income with contracted and speculative income shown separately. Edit any value and the model recalculates. Amounts use one currency and one area unit of your choice.
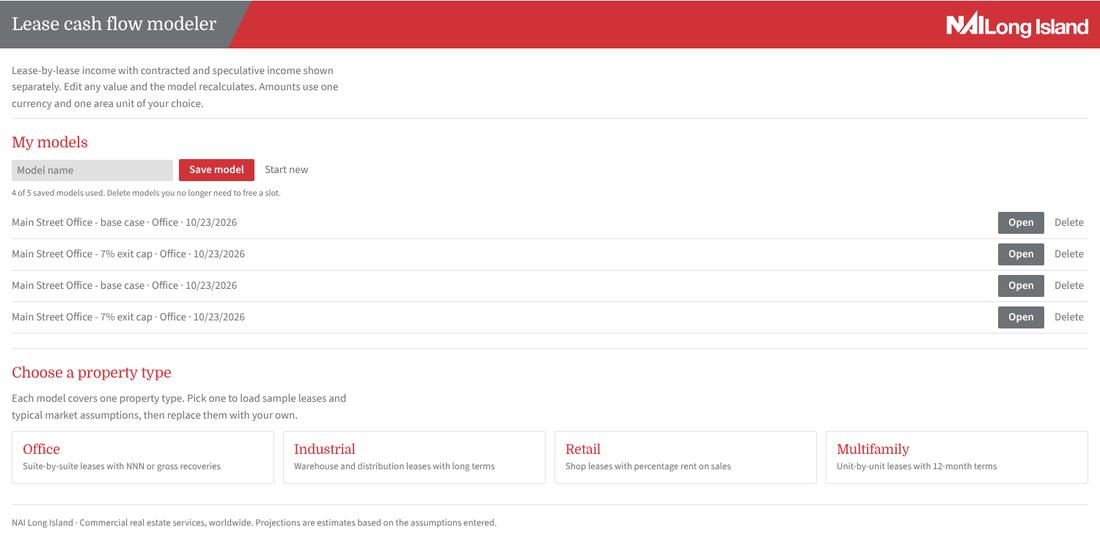
My models
My models
Log in with your NAI Long Island account to save, reopen and delete your models. You can use the modeler and export to Excel without logging in.
Choose a property type
Each model covers one property type. Pick one to load sample leases and typical market assumptions, then replace them with your own.
Property type:
Analysis settings
Financing inputs
Fixed-rate loan (enter a loan amount, or leave it at 0 to size from loan-to-value on the purchase price), with monthly payments and the remaining balance repaid at sale. Set loan-to-value to 0 for an all-equity case.
Market leasing assumptions
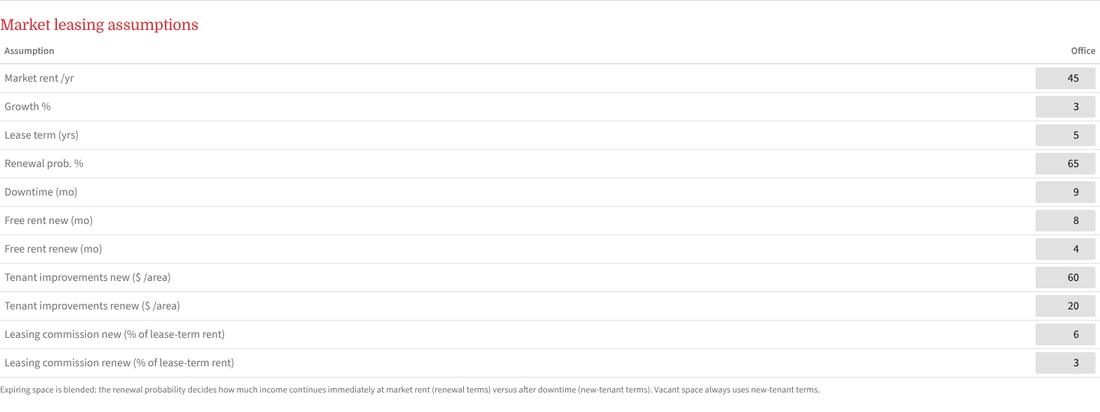
Expiring space is blended: the renewal probability decides how much income continues immediately at market rent (renewal terms) versus after downtime (new-tenant terms). Vacant space always uses new-tenant terms.
Rent roll
Leave the end date empty to model vacant space. Multifamily: use one unit per row (area 1, rent per unit per year). Pro-rata share defaults to the lease RSF divided by total RSF (shown in grey italics); type a percentage to override it. The tax base year amount (annual dollars) appears only for modified gross and gross leases: the tenant reimburses its share of real estate taxes above that amount, which overrides the tax stop in Operating expenses.
Operating expenses
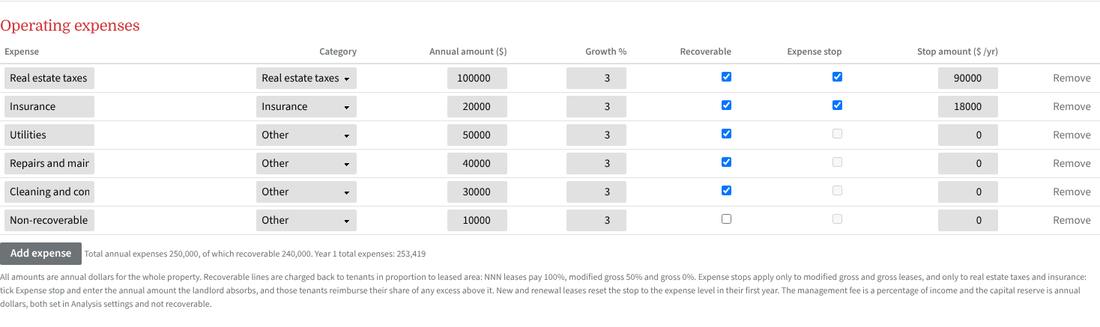
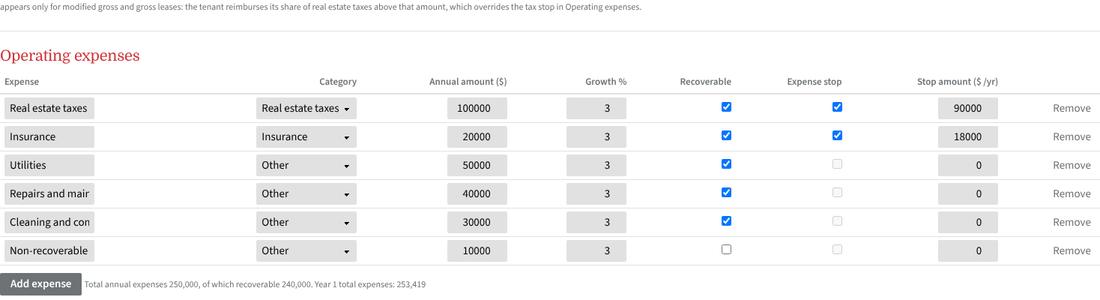
All amounts are annual dollars for the whole property. Recoverable lines are charged back to tenants in proportion to leased area: NNN leases pay 100%, modified gross 50% and gross 0%. Expense stops apply only to modified gross and gross leases, and only to real estate taxes and insurance: tick Expense stop and enter the annual amount the landlord absorbs, and those tenants reimburse their share of any excess above it. New and renewal leases reset the stop to the expense level in their first year. The management fee is a percentage of income and the capital reserve is annual dollars, both set in Analysis settings and not recoverable.
Results
Discounted cash flow and returns
Value by discount rate and exit cap rate
IRR by purchase price and exit cap rate
Unlevered, annual, end-of-year cash flows. The sale price is year-after-hold NOI divided by the exit cap rate, less sale costs. The indicative value is year 1 NOI divided by the going-in cap rate. Choose the pricing basis in Analysis settings: with Going-in cap rate, the price is the indicative value; with Fixed purchase price, the returns, DCF and financing run at the price you enter and the going-in cap rate becomes a result. The DCF value shown above is the present value at your discount rate and exit cap rate, for comparison.
Levered returns and debt service
Levered IRR by loan amount and interest rate
The Lease Cash Flow Modeler builds a lease-by-lease cash flow, discounted cash flow, and levered return analysis for office, industrial, retail, and multifamily property, then lets you save the model to your account and export it to Excel.
Contents
- What the modeler does
- Quick start
- Logging in and saving models
- Choosing a property type
- Analysis settings
- Financing inputs
- Market leasing assumptions
- Rent roll
- Operating expenses
- Reading the results
- DCF and returns
- Levered returns and debt service
- Excel export
- How the numbers are calculated
- Troubleshooting and FAQ
What the modeler does
Every lease is projected month by month, then rolled up to annual figures. Income from leases already in place is kept separate from income that depends on future leasing, so you can see exactly how much of the cash flow is assured.
Rent, annual steps, free rent, recoveries, base years, expense stops, and percentage rent are modeled for each tenant.
In-place income is shown apart from income from renewals, new tenants, and vacant space, which is weighted by probability.
Unlevered IRR, NPV, DCF value, sensitivity tables, debt service, DSCR, and levered IRR.
Log in to save up to five models, and export any model to a formatted Excel workbook.
Edit any value and the whole model recalculates immediately. Amounts use one currency and one area unit of your choice, so use the same units throughout (for example, dollars and square feet).
Quick start
- Log in (optional)Log in with your NAI Long Island username and password if you want to save your work. You can use the modeler and the Excel export without logging in.
- Choose a property typeSelect Office, Industrial, Retail, or Multifamily. The modeler loads sample leases and typical market assumptions for that type.
- Replace the sample dataWork down the page: Analysis settings, Financing inputs, Market leasing assumptions, Rent roll, then Operating expenses.
- Review the resultsThe Results, DCF, and Levered returns sections update as you type.
- Save and exportType a name in My models and select Save model. Select Export to Excel for a workbook you can share.
You can open this guide at any time from the modeler: select Help and user guide at the top right, and Back to the modeler to return to your work. Nothing you have entered is lost.
Logging in and saving models
The modeler uses your regular WordPress account. Log in on the normal site login page, then return to the modeler. The Log in link in the My models area takes you there and brings you back to the same page afterward. The modeler never sees your password.
What logging in gives you
- A private list of saved models that only you can see, on any computer where you log in.
- A limit of 5 saved models per user. Your administrator can change this limit.
Saving a model
- Type a name in the Model name box (up to 80 characters).
- Select Save model. The message “Saved” appears and the list updates, along with the count of slots used (for example “2 of 5 saved models used”).
If you opened a saved model and keep its name, Save model replaces that model, even when you are at the limit. If you change the name, Save model creates a new model and uses a slot. This is how you keep scenarios, for example “Main Street, base case” and “Main Street, 7% exit cap”.
Opening a model
Select Open beside a model. It loads the property type, leases, assumptions, and expenses exactly as you saved them. The list shows each model’s name, property type, and the date it was last saved.
Starting a new model
Select Start new to clear the model name so that the next save creates a new model. It does not clear the numbers on screen. To start from fresh sample data, select Change property type and pick a type again.
Deleting a model
Select Delete beside the model. The button changes to Confirm delete; select it again within a few seconds to delete. If you wait, the button reverts and nothing is deleted. Deleting is permanent and frees the slot at once.
If you already have 5 models and try to save a sixth, you will see “Limit reached” and nothing is saved. Delete a model you no longer need, then save again.
Not logged in
Visitors who are not logged in can use every calculation and the Excel export, but nothing is stored. Closing or reloading the page discards the model, so export to Excel first if you want to keep it.
Choosing a property type
Each model covers one property type. The choice sets the sample leases, the market leasing assumptions, the expense lines, and the wording of some columns.
| Type | Typical use | What changes |
|---|---|---|
| Office | Suite-by-suite leases with NNN, modified gross, or gross recoveries | Rent in dollars per RSF per year. |
| Industrial | Warehouse and distribution leases with long terms | Rent in dollars per RSF per year, with lower rents and costs per foot. |
| Retail | Shop leases with percentage rent on sales | Adds Sales /area and Pct rent % columns to the rent roll. |
| Multifamily | Unit-by-unit leases with 12-month terms | One row per unit. Columns are renamed Units, Unit no., and Rent per unit/yr. Enter 1 unit per row. |
To switch type later, select Change property type, next to the property type heading above Analysis settings. The modeler asks you to confirm because unsaved changes are lost. Save first if you want to keep your work.
Analysis settings
These settings apply to the whole property and drive the return calculations.

| Field | What it does |
|---|---|
| Analysis start | The date the cash flow begins. Year 1 runs for twelve months from this date, and lease dates are measured from it. |
| Hold period (years) | How long you expect to own the property, from 1 to 30 years. The sale happens at the end of the last year. |
| Inflation for reserves % | Annual growth applied to the capital reserve. |
| Management fee % | A percentage of total income, deducted every year. It is not recovered from tenants. |
| Discount rate % | The yearly rate used to discount cash flows to a present value (the DCF value and NPV). |
| Exit cap rate % | Used to price the sale: the sale price is the net operating income of the year after the hold period divided by this rate. |
| Pricing basis | Chooses how the purchase price is set. See below. |
| Purchase price | Shown only when Pricing basis is Fixed purchase price. It is the price you enter. |
| Going-in cap rate % | Shown only when Pricing basis is Going-in cap rate. The price is year 1 net operating income divided by this rate. |
| Sale costs % | Percentage of the sale price deducted at sale. |
| Acquisition costs % | Percentage of the purchase price added to the amount invested at purchase. |
| Capital reserve (annual $) | Annual dollars set aside for capital items for the whole property. It is deducted after net operating income, grows with inflation for reserves, and is not recoverable from tenants. |
Pricing basis: two ways to set the price
- Going-in cap rate (the default). The price is the indicative value: year 1 NOI divided by the going-in cap rate. Use this to ask “what is the property worth at this cap rate?”
- Fixed purchase price. Enter the price. Returns, DCF, and financing all run at that price, and the going-in cap rate becomes a result (year 1 NOI divided by your price). Use this to test a specific offer. If you choose this basis but leave the price at 0, the modeler uses the indicative value instead.

Financing inputs
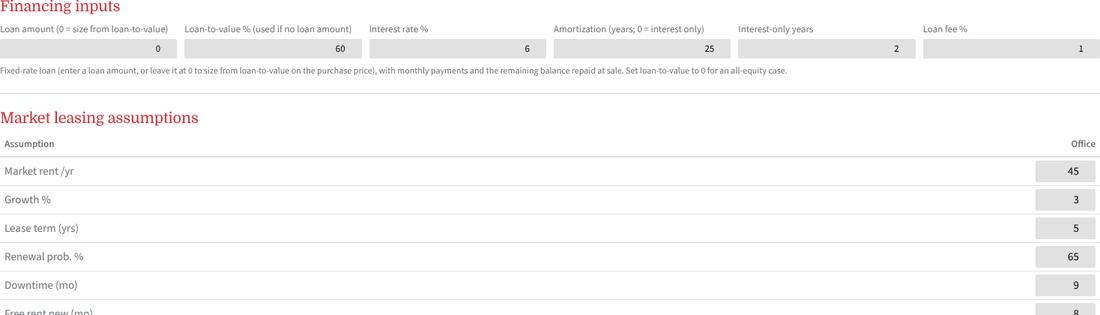
Describe the loan to see debt service and levered returns. For an all-cash case, set Loan-to-value % to 0 and leave Loan amount at 0.

| Field | What it does |
|---|---|
| Loan amount | The loan in dollars. Leave at 0 to size the loan from loan-to-value. |
| Loan-to-value % | Used only when Loan amount is 0. The loan is this percentage of the purchase price. |
| Interest rate % | A fixed annual rate, paid monthly. |
| Amortization (years) | The schedule used to compute principal payments once amortization begins. Enter 0 for an interest-only loan. |
| Interest-only years | The number of years at the start when only interest is paid. |
| Loan fee % | A percentage of the loan paid at closing. It is added to the equity you invest. |
Payments are calculated monthly and added up by year. The remaining loan balance is repaid from the sale proceeds. Results appear in Levered returns and debt service.
Market leasing assumptions
These assumptions describe what happens when a lease expires and for space that is vacant today. They are the main source of speculative income.
| Assumption | What it means |
|---|---|
| Market rent /yr | Current market rent per area unit per year (for multifamily, per unit per year). |
| Growth % | Annual growth in market rent, tenant improvements, and (for retail) tenant sales. |
| Lease term (yrs) | Length of each new or renewal lease. Re-leasing repeats at this interval through the hold period. |
| Renewal prob. % | The chance an expiring tenant renews. See below for how it is used. |
| Downtime (mo) | Months of vacancy before a new tenant starts after an expiry. |
| Free rent new / renew (mo) | Months of free base rent at the start of a new lease, and of a renewal lease. |
| Tenant improvements new / renew ($ /area) | Tenant improvement allowance per area unit, for new and renewal leases. Paid at lease commencement. |
| Leasing commission new / renew (% of lease-term rent) | Commission as a percentage of the total base rent over the lease term (market rent × lease term in years × area). Paid in full at rent commencement for new leases and at renewal commencement for renewals. |
How an expiring lease is modeled
The renewal probability blends two outcomes, so you see an expected result rather than a single guess:
- Renewal (with the renewal probability): the tenant continues straight away at market rent, with the renewal free rent, renewal tenant improvements, and renewal commission.
- New tenant (the remainder): the space is vacant for the downtime, then re-let at market rent with the new-tenant free rent, tenant improvements, and commission.
Vacant space has no renewal option, so it always uses the new-tenant terms, starting after the downtime.
Leasing commissions: an example
With the Office sample, a new-tenant commission of 6% on a 5-year term at $45 market rent is 6% × $45 × 5 = $13.50 per RSF (before growth). A renewal at 3% is $6.75 per RSF. A new lease with 8 months of free rent pays its commission 8 months after the lease starts, when rent begins. A renewal pays on the day the renewal begins.
Sample values by property type
These are starting points. Replace them with your own market data.
| Assumption | Office | Industrial | Retail | Multifamily |
|---|---|---|---|---|
| Market rent /yr | 45 | 9 | 40 | 27,000 |
| Growth % | 3 | 2.5 | 2 | 3 |
| Lease term (yrs) | 5 | 5 | 5 | 1 |
| Renewal prob. % | 65 | 70 | 60 | 55 |
| Downtime (mo) | 9 | 6 | 8 | 1 |
| Free rent new / renew (mo) | 8 / 4 | 4 / 2 | 6 / 3 | 0.5 / 0 |
| TI new / renew ($ /area) | 60 / 20 | 8 / 3 | 50 / 15 | 1,200 / 300 |
| Commission new / renew (%) | 6 / 3 | 5 / 2.5 | 6 / 3 | 0 / 0 |
| Capital reserve (annual $) | 10,000 | 9,000 | 7,000 | 750 |
Rent roll
The rent roll lists each lease in place plus any vacant space. Each row is one lease or suite. Edit a cell to change it, select Add lease to add a row, and select Remove to delete one.

| Column | What to enter |
|---|---|
| Tenant, Suite | Names for your reference. They carry through to the Excel export. |
| RSF | Leased rentable area. For multifamily this column is Units: enter 1 per row. |
| Pro-rata share % | The tenant’s share of recoverable expenses. Left alone, it is calculated as the lease’s RSF divided by total RSF and shown in grey italics. Type a percentage to override it. |
| Lease start, Lease end | Dates of the lease. Leave Lease end empty to model vacant space. The lease runs through the end of the end month. |
| Rent PSF/yr | Starting annual base rent per RSF. For multifamily this column is Rent per unit/yr. |
| Step % | Annual rent increase, applied on each anniversary of the lease start. |
| Free mo | Months of free base rent from the lease start. Rent is zero during this period, but recoveries are still billed. |
| Lease type | NNN, Modified, or Gross. This sets how much of the recoverable expenses the tenant reimburses. See below. |
| Tax base year amount ($/yr) | Shown only when at least one lease is Modified or Gross, and left blank on NNN rows. The annual real estate tax amount the landlord absorbs for that tenant. |
| Sales /area, Pct rent % | Retail only. Annual sales per area unit and the percentage rent rate. |
Lease types and recoveries
| Lease type | Share of recoverable expenses the tenant pays |
|---|---|
| NNN | 100% |
| Modified | 50%, unless a base year amount or expense stop applies, in which case the tenant pays only the excess above it |
| Gross | 0%, except for the excess above a base year amount or an expense stop |
The tenant’s reimbursement is its pro-rata share of the recoverable expenses, multiplied by the percentage above. The total appears as Recoverable expense income in the cash flow.
Tax base year amount
For a Modified or Gross lease, enter the annual real estate tax amount in the tenant’s base year. The tenant reimburses its share of taxes above that amount. When a base year amount is entered, it overrides the real estate tax stop set in Operating expenses for that tenant.
Percentage rent (retail)
The tenant pays the percentage rent rate on its annual sales, but only the part that exceeds its base rent. For example, a tenant with $900 in sales per area at 7% owes $63 per area; if base rent is $62, the extra is $1 per area. Sales grow with the market growth rate.
Tips
- Enter every rentable suite, including vacant ones, so pro-rata shares add up correctly.
- A new row starts with the analysis start date, 1,000 area units (1 for multifamily), NNN, and no end date, so it is treated as vacant until you enter an end date and rent.
- The table scrolls sideways on narrow screens.
Operating expenses
List the property’s operating expenses and mark which ones are charged back to tenants.
| Column | What it does |
|---|---|
| Expense | The name of the line. |
| Category | Other, Real estate taxes, or Insurance. Only taxes and insurance can have expense stops. |
| Annual amount ($) | The yearly cost for the whole property, in dollars (not per area unit). |
| Growth % | Annual growth in the expense. |
| Recoverable | When ticked, the line is charged back to tenants according to their lease type and pro-rata share. |
| Expense stop | Available for taxes and insurance. Ticking it applies a stop to Modified and Gross leases. |
| Stop amount ($ /yr) | The annual amount the landlord absorbs. Tenants on Modified and Gross leases reimburse their share of any excess. |
Below the table, a summary shows total annual expenses, the recoverable part, and the year 1 total. Add expense adds a line and Remove deletes one.
Expense stops
An expense stop is the annual amount of a tax or insurance line the landlord pays; tenants reimburse their pro-rata share of the excess. Stops apply only to Modified and Gross leases. NNN tenants pay their share of the whole expense. New and renewal leases created by the market assumptions reset the stop to that year’s expense level, so they pay only increases from their first year.
The management fee and the capital reserve are set in Analysis settings. They are not recoverable.
Reading the results
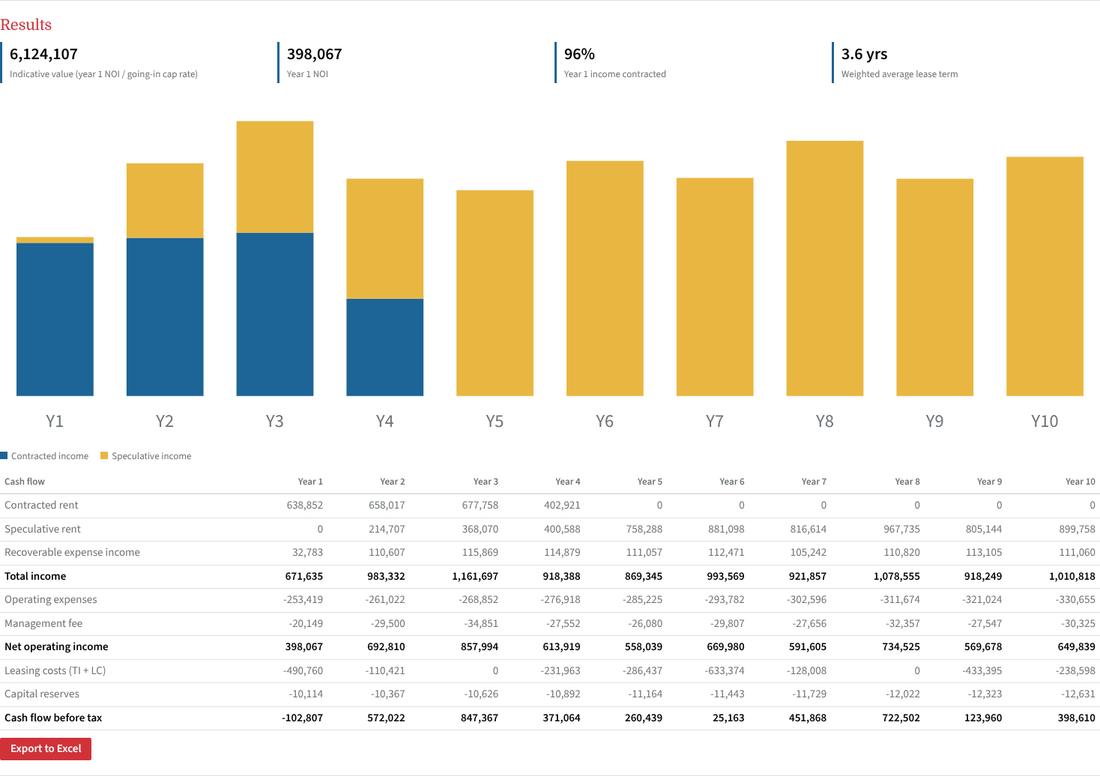
Key figures
| Figure | Meaning |
|---|---|
| Indicative value | Year 1 NOI divided by the going-in cap rate. When the pricing basis is Fixed purchase price, this shows your price and the going-in cap rate it implies instead. |
| Year 1 NOI | Net operating income in the first year. |
| Year 1 income contracted | The share of year 1 income that comes from leases already in place. A high number means a more assured income stream. |
| Weighted average lease term | The remaining term of the leases in place, weighted by rent. |
The chart
Each bar is one year of income. Blue is contracted income from leases in place. Gold is speculative income from renewals, new tenants, and vacant space. As leases expire the gold share grows, showing how much of the income depends on future leasing.
The cash flow table
| Line | Meaning |
|---|---|
| Contracted rent | Base and percentage rent from leases in place, up to each lease’s end date. |
| Speculative rent | Probability-weighted rent from renewals, new tenants, and vacant space. |
| Recoverable expense income | Expenses reimbursed by tenants, from both contracted and speculative leases. |
| Total income | The sum of the three lines above. |
| Operating expenses, Management fee | Deducted from income. |
| Net operating income | Total income less operating expenses and the management fee. |
| Leasing costs (TI + LC) | Tenant improvements and leasing commissions, in the year they are paid. |
| Capital reserves | The annual capital reserve. |
| Cash flow before tax | NOI less leasing costs and reserves. |
DCF and returns
This section values the property as an unlevered (no debt) investment. It uses annual, end-of-year cash flows, with the purchase in year 0.
| Figure | Meaning |
|---|---|
| Unlevered IRR | The yearly return on the purchase price including acquisition costs, from the cash flows and the sale. |
| NPV at the discount rate | The DCF value less the amount invested. Positive means the deal returns more than your discount rate. |
| DCF value | The present value of the cash flows and the sale at your discount rate and exit cap rate. Compare it with the price. |
| Equity multiple | Total cash received (operating cash flow plus net sale proceeds) divided by the amount invested. |
| Going-in cap rate (year 1 NOI) | Year 1 NOI divided by the purchase price. |
| Purchase price | The price used, either fixed or derived from the going-in cap rate. |
The table lists the purchase, operating cash flow, net sale proceeds, net cash flow, discount factor, and present value for each year.
Sensitivity tables
- Value by discount rate and exit cap rate: DCF value as each rate moves up and down in half-point steps.
- IRR by purchase price and exit cap rate: unlevered IRR for prices from 90% to 110% of your price.
Levered returns and debt service
| Figure | Meaning |
|---|---|
| Loan amount, Loan-to-value | The loan used, and the loan as a percentage of the purchase price. |
| Equity invested | Purchase price plus acquisition costs, less the loan, plus the loan fee. |
| Levered IRR | The yearly return on your equity after debt service and loan repayment at sale. |
| Levered equity multiple | Total cash returned to equity divided by equity invested. |
| Lowest DSCR | The lowest debt service coverage ratio of any year (NOI divided by debt service). Lenders commonly look for 1.20 or higher. |
| Debt yield, year 1 | Year 1 NOI divided by the loan amount. |
| Cash-on-cash, year 1 | Year 1 cash flow after debt service divided by equity invested. |
The table shows, by year, cash flow before debt service, interest, principal, debt service, DSCR, cash flow after debt service, the equity investment, sale proceeds less loan repayment, and the equity cash flow. The last sensitivity table shows levered IRR by loan amount and interest rate.
Excel export
Select Export to Excel at the bottom of the Results section. The workbook, named lease-cashflow.xlsx, downloads straight to your computer. It reflects the numbers on screen at that moment. You do not need to be logged in.
| Sheet | Contents |
|---|---|
| Assumptions | The analysis, financing, and market assumptions behind the model. |
| Rent roll | The same columns as the rent roll on screen, including suite, pro-rata share, lease type, and base year amounts. |
| Tenant income | A tenant-by-tenant income projection for the whole hold period, with detail by tenant. |
| Cash flow | The annual cash flow, with totals, NOI, and cash flow before tax as Excel formulas. |
| DCF and IRR | The discounted cash flow, with IRR and NPV as Excel formulas. |
| Operating expenses | Each expense line, with its category, growth, recovery, and stop. |
| Financing | Net operating income, debt service, DSCR, and the levered cash flows and IRR. |
The workbook uses standard accounting, percentage, and decimal formats, so it is ready to review or share.
The export is a snapshot. To compare scenarios, save each one as its own model and export each, or export before you change an assumption.
How the numbers are calculated
Monthly projection
The model steps through every month of the analysis. For each lease it works out base rent (with annual steps and any free rent), percentage rent, and recoveries. Months are then added into years. Expenses grow monthly at their annual growth rate.
Contracted and speculative income
Income to a lease’s end date is contracted. After that, the renewal probability splits the space into a renewal share and a new-tenant share, each with its own downtime, free rent, tenant improvements, and commission. That blended income is speculative. Because income is probability weighted, a result can be a fraction of a lease; it represents the expected value, not a single outcome.
When leasing costs are paid
- Tenant improvements: paid when the new or renewal lease commences.
- Leasing commission: paid in full at rent commencement for a new lease (after its free rent), and at renewal commencement for a renewal.
- The cost grows with the market growth rate to the date of the lease.
Purchase, sale, and returns
- Amount invested = purchase price × (1 + acquisition costs %).
- Sale price = NOI of the year after the hold period ÷ exit cap rate.
- Net sale proceeds = sale price × (1 − sale costs %).
- Unlevered IRR uses the amount invested in year 0, each year’s cash flow before tax, and net sale proceeds in the final year.
- DCF value = the present value of those future cash flows at the discount rate. NPV = DCF value less the amount invested.
- Levered IRR uses equity invested in year 0, cash flow after debt service each year, and sale proceeds less the loan balance in the final year.
The modeler produces estimates from the assumptions you enter. Results are only as good as those inputs, and it does not replace appraisal, underwriting, tax, or legal advice.
Troubleshooting and FAQ
I see the text [lease_cashflow_modeler] instead of the modeler.
The shortcode was added somewhere WordPress does not process it. In the block editor, use a Shortcode block (not a Paragraph or Code block). Make sure the plugin is activated.
Saving, opening, or deleting fails with “Could not complete that”.
The browser could not reach the WordPress REST API. Visit yoursite.com/wp-json/lcm/v1/models while logged out. A working site shows a short message that says “Please log in to save models”. If you see a different error or a blocked page, a security plugin, firewall, or host rule is blocking the REST API. Allow the /wp-json/lcm/ route (or ?rest_route=/lcm/ if your site uses plain permalinks).
It says “Your session has expired. Reload this page and log in again.”
You were logged out, or the page’s security token expired (they last about a day). Reload the page, and log in again if asked. If it happens right after logging in, the page is being cached; see Caching in the Administrator guide.
It says “Limit reached” when I save.
You have used all of your slots. Delete a model you no longer need, then save again. You can still save over a model you opened, using the same name. An administrator can raise the limit in Settings > Cash Flow Modeler.
Export to Excel does nothing.
Check that your browser or an extension is not blocking downloads from the site. If the button works on a plain page but not on yours, a plugin that combines or defers JavaScript may be breaking it; exclude lcm.js and xlsx.full.min.js.
The modeler looks unstyled or too narrow.
Use a full-width or wide page template. If styles look wrong, clear your site and browser caches, and exclude the plugin’s CSS from any minify or combine tool. The plugin’s styles apply only inside the modeler and do not change the rest of your theme.
Can other users see my models?
No. Models are private to the account that saved them. To share a model, export it to Excel.
How do I model a vacant suite?
Add a lease row with its area and leave Lease end empty. Vacant space is leased after the downtime using the new-tenant terms, so it appears as speculative income.
How do I model multifamily?
Choose Multifamily and use one row per unit. Enter 1 in Units, the unit number in Unit no., and the annual rent in Rent per unit/yr. Market rent, tenant improvements, and costs are also per unit.
What currency and area unit does it use?
Whichever you like, as long as you are consistent. The modeler does not convert units, so enter all amounts in one currency and all areas in one unit (for example, square feet or square meters).
Why are my results fractions of a lease or non-round numbers?
Speculative income is probability weighted using the renewal probability, so it shows an expected value rather than one outcome.
Why did the results of an older saved model change?
Models saved before leasing commissions were added open with the current default commission rates. Review the Leasing commission rows in Market leasing assumptions and save again to keep your own rates.
What is the longest hold period?
Thirty years. Values outside 1 to 30 are adjusted to that range.
I lost unsaved changes when I changed the property type.
Changing the property type starts a new model from sample data, which is why it asks for confirmation. Save your work first with Save model.
What You Can Do With CRE Financial Modeling
- Lease-by-lease cash flow: Enter each tenant’s rent, escalations, expiration dates and recoveries to project income year by year.
- Discounted cash flow (DCF): Apply a discount rate and exit cap rate to estimate the present value of the property.
- IRR and returns: Measure unlevered and levered returns to compare opportunities on a consistent basis.
- Financing: Model loan amount, interest rate and amortization to see how debt affects cash flow and returns.
- Save and export: Store your models and export results to Excel for further analysis or to share with partners and lenders.

Why Lease-by-Lease Analysis Matters
Two buildings with the same occupancy can have very different risk profiles. One may have long-term leases with creditworthy tenants, while the other has several leases expiring in the same year. Modeling each lease individually shows when rollover occurs, how much downtime and leasing cost to expect, and how rent increases flow through to net operating income. That level of detail leads to more accurate valuations and better decisions.
Key Metrics Explained
Net operating income (NOI) is a property’s income after operating expenses but before debt service. Cap rate divides NOI by value and is a quick way to compare pricing. Internal rate of return (IRR) accounts for the timing of every cash flow, including the eventual sale, to show the annualized return on an investment. Cash-on-cash return compares annual cash flow after debt service to the equity invested. Good CRE financial modeling looks at all of these together rather than relying on a single number.
Who Uses CRE Financial Modeling?
Private investors use it to evaluate acquisitions and decide how much to offer. Property owners use it to plan refinancing, budget capital projects and understand how lease renewals will affect value. Brokers use it to support pricing recommendations and prepare offering materials, and lenders and appraisers rely on similar analysis when underwriting loans. Whether you are reviewing a single retail building or a multi-tenant industrial park, a consistent model makes it easier to communicate assumptions and compare results with partners.
Because the app saves your work, you can return to a model as a deal evolves, update rents or expenses as new information arrives, and keep a record of how your assumptions changed over time. Exporting to Excel lets you add custom schedules, share files with lenders and partners, or combine results into a larger portfolio analysis.
Tips for Better Models
Strong CRE financial modeling starts with actual rent rolls and operating statements whenever possible, and be realistic about vacancy, tenant improvements, leasing commissions and capital reserves. Run a base case along with conservative and optimistic scenarios so you understand the range of possible outcomes. Small changes to the exit cap rate or rent growth assumptions can have a large impact on value, so test them carefully.

Get Expert Support
Models are only as good as their assumptions. Our capital markets team can review your underwriting, provide market rents and comparable sales, and help you price an acquisition or disposition. Contact NAI Long Island to discuss a property, or try our commercial mortgage loan calculator and lease commission calculator. As a member of NAI Global, we bring national market data to every analysis.
Results from this CRE financial modeling app are estimates for planning purposes only and should not be relied on as an appraisal or investment advice.